SSP and Sigma: building real-time insight from 40 million rows

SSP
SSP are a food and beverage company that operate in travel hubs across 38 countries, c.575 locations and over 3000 units. They manage a portfolio of hundreds of brands including their own brands such as Upper Crust, and brand partners that include Starbucks and Burger King.
Key outcomes
We helped SSP develop a solution that allowed a view of every transaction they hosted, and developed a dashboard that didn’t buckle under copious rows of data. The partnership helped SSP:
Fragmented POS data
into a cloud-powered Sigma data app
Slow Excel extraction
to real-time exploratory analysis
Business value
through data-driven promotional offers, optimised shelf space and strengthened supplier negotiations

An actionable solution without buckling under data
For SSP, accessing that granularity was a significant hurdle. While existing dashboards provided a holistic view of performance, they buckled under the weight of over 40 million rows of data, making product level drill-downs nearly impossible.
The Commercial teams found themselves in a common retail trap - teams could see the “what”, “where”, “when”, but never the “why” behind the sales data. They were:
Forced to manually extract transactional data into Excel to perform strategic analysis
Using rigid dashboards that lacked flexibility needed for deep, exploratory data analysis
Choosing areas of focus without data to support these decisions that resulted in a lack of standardised product categorisation

A unified solution that standardised product data creating a unified data foundation
Towards the end of 2025 we launched an 8 week engagement to transform SSP’s analytical capabilities. Following an intensive discovery phase, we prioritised the DACH region (Germany, Austria, Switzerland) to pilot a high-impact market basket analysis use case.
One of the key challenges we came across was the inconsistencies within the dataset, which was caused by disparate POS systems and different languages across the DACH region. There were 44,000 unique product rows, so a manual approach was not feasible. We used AI to generate and refine categorisation scripts, successfully mapping products into a unified structure, which created the essential data foundation for this app to be built on.Our team:
Engineered silver and gold data layers within Databricks
Utilised AI to automate and standardise product categorisations, allowing for regional (and future global) consistency in product analysis for the first time
Ensured maximum performance, by the design of an OBT (One Big Table) schema optimised for cloud-scale computing
Deployed Sigma - this enabled the team to query the Databricks warehouse directly. This eliminated data movement and provided a familiar, spreadsheet-style interface capable of pivoting millions of rows in seconds.
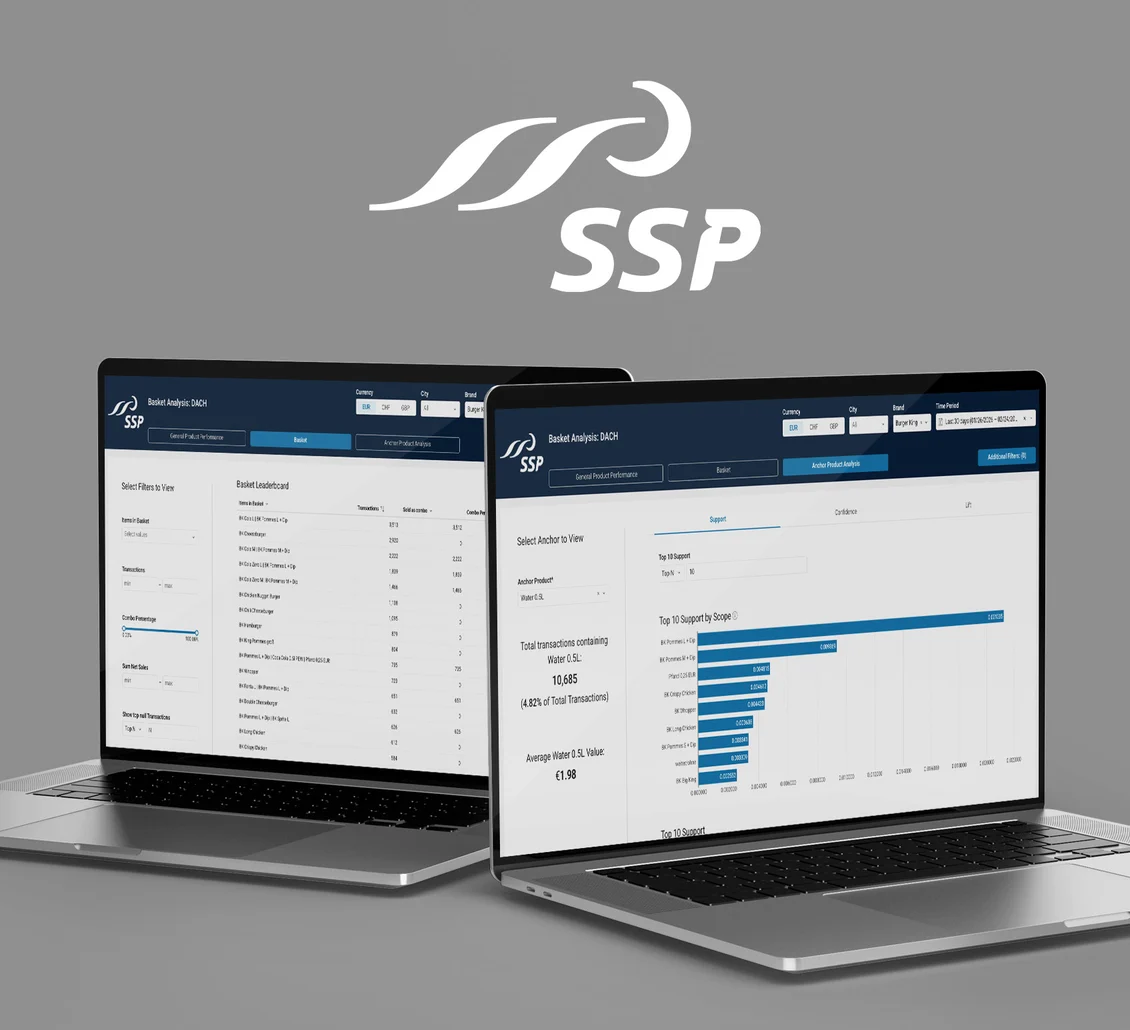
Moved beyond static charts to build an interactive data app, allowing commercial teams to identify popular product combinations, view general product performance metrics and see how ‘anchor products’ help drive core sales. All in real time.
The three main views
We built a fully interactive data app in Sigma with 3 main views to drive retail insights: Product Performance drilldown, Basket Leaderboard and Anchor Product Analysis - incorporating Market Basket Analysis metrics like Lift, Support and Confidence.
The Product Performance view
serves as a centralised resource for readily accessible product performance data, with the ability to drill down allowing users to view data at different levels of granularity.
The Basket Leaderboard view
allows commercial teams to view which items are commonly bought together to form a basket. With the ability to view the amount of time a basket was bought as a ‘combo’ alongside common sales metrics.
The Anchor Product Analysis view
is based on key driver products which are classed as an ‘anchor’. This page allows commercial teams to select an anchor product and view the most common attached products based on Market Basket Analysis metrics.

An AI-powered data layer enabling real-time, interactive product analysis for commercial teams
The transition from manual extraction to dynamic exploration has redefined how SSP’s commercial teams interact with their data. By leveraging Sigma’s ability to handle massive datasets without compromising speed, the business unlocked immediate value in the form of:
Enhanced shelf-space optimisation and the ability to design data driven promotional offers based on actual consumer "baskets"
Rapid identification and delisting of non-performing products, streamlining inventory
Commercial teams armed with precise transactional evidence to support and win supplier negotiations
Significant reduction in hours spent on manual data collation, freeing commercial teams for high-value strategic planning
Opening of the door to future value opportunities due to standardised product categorisations
By combining deep Food & Beverage Travel expertise with a rich, enterprise-scale dataset, we've shown how AI can be applied practically to drive real commercial impact. This initiative brought together a truly cross-functional team from SSP and AND, blending human judgement with advanced technology to convert data into a strategic business asset.
Sigma, Databricks
More successful digital transformation projects delivered by AND Digital

The Observer and Tortoise Media
The Observer and Tortoise Media unite in one digital platform
Media & PublishingSoftware development & serviceAI, intelligent systems & agentic operations
IAG Loyalty
Modernising the Avios mobile app without breaking delivery
Hospitality & LeisureSoftware development & service
IAG Loyalty
Using technology and data to boost the Avios loyalty programme
Hospitality & LeisureSoftware development & serviceData platforms & product